Why tracking HRV throughout the night is useful?
Research links high heart-rate-variability to good health and an optimal level of fitness, while decreased HRV is associated with stress and fatigue.
Tracking Heart-Rate-Variability throughout the night will give you a detailed picture of progression of your recovery during the night. The evening HRV value shows accumulated stress over the day, and morning HRV provides recovery status and readiness for a new day.
HRV data allows you to optimize your training schedule according to actual body requirements, helping you avoid overtraining and giving you a peak performance at the office too. Long-term evaluation of HRV will determine how effectively your exercise or lifestyle changes are affecting your wellness.
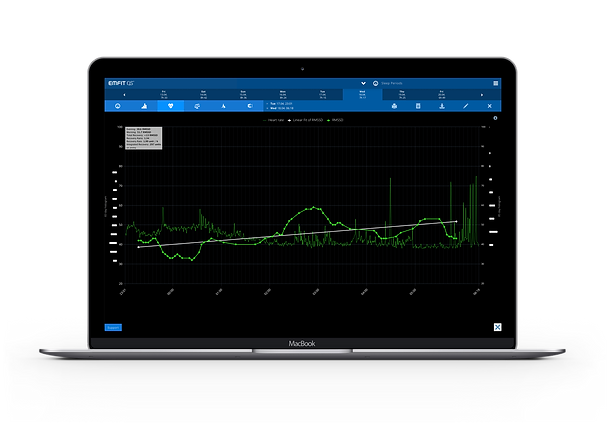
EMFIT QS is unique with its capability to track Heart-Rate-Variability throughout the night. It gives you a detailed picture of progression of your recovery during the night.

The evening HRV value shows accumulated stress over the day, and morning HRV provides recovery status and readiness for a new day.

Optimize your performance with whole night
Heart-Rate-Variability
RMSSD is a value calculated from heart-rate-variability. It can be used to monitor both their daily training load, and nocturnal recovery.
Heavy training and stress lowers the RMSSD value, and recovery during night raises it. If the evening value is low, you know that training day was effective. If the morning value is high, you are fully recovered and ready for another heavy exercise. In this sense, our RMSSD graph can be used to optimize both the training schedule and load.
For those who do not do not do heavy, daily physical exercise and days are easier, HRV is usually higher in the evening than in the morning. That's normal too! HRV is highly individual and for healthy persons it fluctuates typically in between around 20 to 40, even up maybe 50 -60. Long term very low values below 15 could indicate stress or else. Very high values around 90 - 100 or even above can be seen also with heart beat irregularities. After all, HRV is about changes in between beat-to-beat time in milliseconds.
HRV Recovery Graph – good recovery
-
Evening value (at left) of the linear fit (white line) RMSSD value is located just below of longest histogram bar of historical values. It could indicate that day was perhaps a bit heavier or stressful than usual days.
-
Morning value is higher than longest bar on morning histogram, indicating that recovery better than usual.
-
Total recovery is 21.5 units, giving Recovery Ratio of 1.66.
-
Recovery Ratio values > 1 are “good”, and values clearly < 1 not so good.
-
After light day one cannot expect high recovery!

HRV Recovery Graph – light day, neutral recovery
-
In this example the evening value is somewhat higher, perhaps after a light day -> there is not much need for the recovery!
-
Early in the night there is more variation in RMSSD values, these cease towards morning. This may indicate that body is ready to wake up.
-
After light day a low Recovery Ratio and a low Total Recovery are usual, and not a bad thing at all.

HRV Recovery Graph – heavy day, negative recovery
-
In this example the evening value against histogram (historical values) is clearly higher than usual. In this case it could indicate a heavy/stressful day. It even goes down towards morning and is clearly lower than historical values.
-
Downward trend in a case like this, comparing to historical values, could indicate some stress, for example if work related matters starts to go around in ones head in the morning hours. Could also mean some physical problem arising, some sickness perhaps. HRV numbers are individual and user alone knows best what else is going on in his/her life and how to interpret the data.